Data Exploration & Visualization
Below are some graphs and plots from our analysis of the provided and externally obtained data.
Comment Data
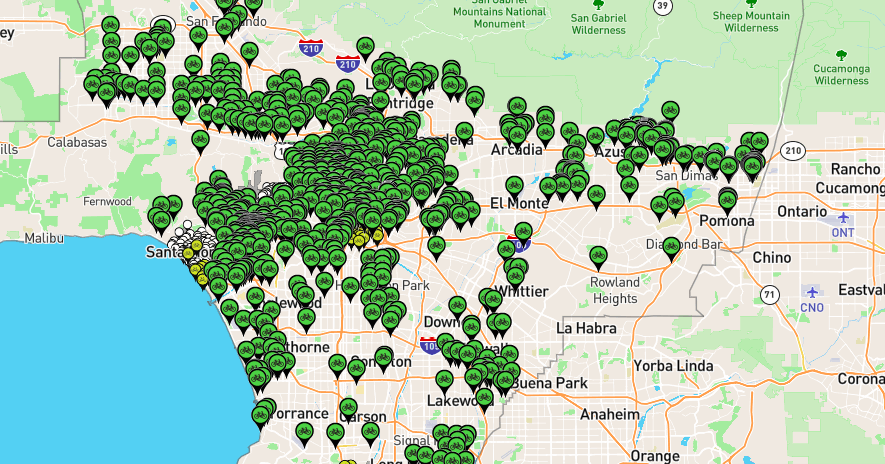
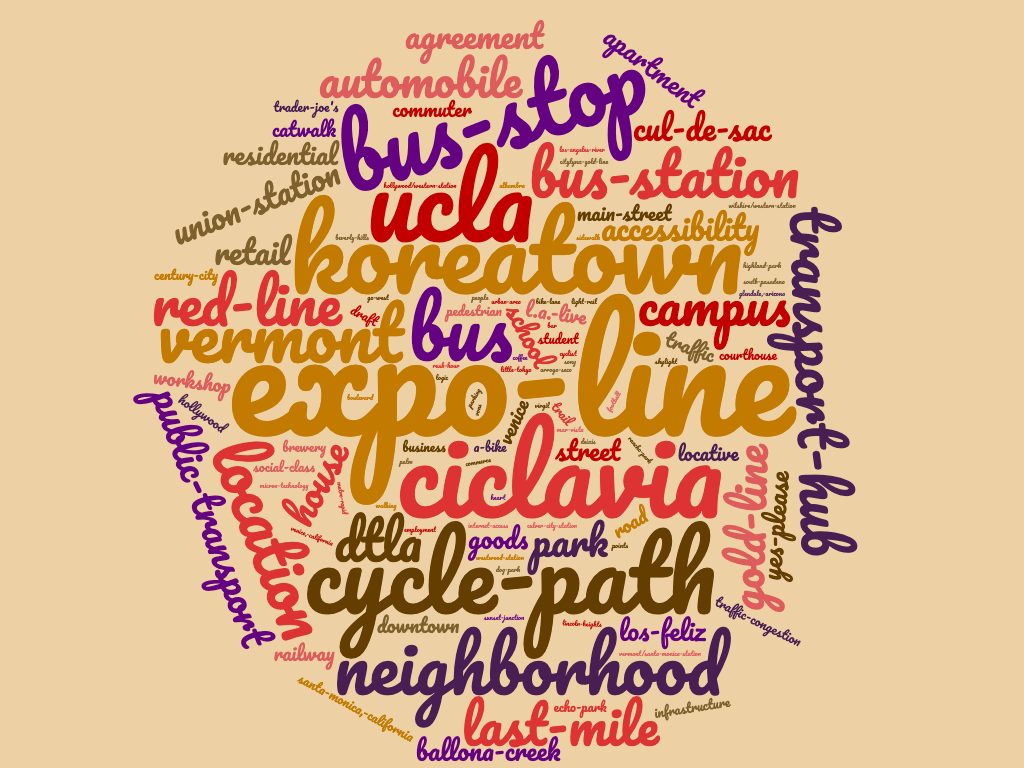
Metro Bike Share provides a website for users to suggest stations and leave comments on suggested stations. The map of suggested stations can be found here and a screenshot of the suggestion page is included below.
Provided Data
Distribution of Bikes at Stations
By creating a markov chain representing stations as the states each a bike can be in, we can find the steady state probability a bike is any given station. By multiplying this probability by 1240 (approximately what we have computed for the number of active bikes at any given time) we get the expected number of bikes in each station. Each station has its own number of docks, but generally anything over 25 is cause for concern as there will likely be more bikes than docks. This is useful information in determining the staging of bicycles i.e. moving them from high probability stations to low probability stations. The following table contains information about the extremums of the expected cumber of bikes for the stations:
| Station ID | Percentage of Total Bikes | Expected Number of Bikes |
|---|---|---|
| 4215 | 0.03034476 | 37.63 |
| 4214 | 0.02443431 | 30.3 |
| 4210 | 0.02258008 | 28 |
| 3005 | 0.0206907 | 25.66 |
| 4207 | 0.0087878 | 10.9 |
| 4125 | 0.00163297 | 2.02 |
| 4127 | 0.00221579 | 2.75 |
| 4135 | 0.00343244 | 4.5 |
A full detailed report of our findings and prediction models can be found here.